Product
Home > Product > NOA
NOA

→Improved the resonance wave
- Features
→Improved the resonance wave
Traditional coil testing machines are produced using SCR pulse generator, comparing the tested coil resonance waveform with the master waveform, and then judging it as good or bad coil according to the difference area of both waveform’s comparison. But we are convinced that the resonance waveform changing is not only from layer-short happened, so it is not correct completely to say < Waveform changing = Coil layer-short happened>
The view of full waveform comparison method means to compare all data that are inside the two coil waveforms, which data include 3 factors such as layer-short happened, pulse voltage instability and core permeability inconsistency. However, the core permeability is totally unrelated to the coil characteristics, so it is very hard to find out the layer-short coil with the waveform comparison method.
Almost all coil testing machines on the market has been using SCR circuit generating pulse waveform and the full waveform comparison method. Almost all manufacturers did not do their effort trying to analysis the complex coil waveform and trying to find out the real coil layer-short phenomenon, they just simply used the full waveform comparison method.
We have been doing much effort on the method of Power MOSFET circuit generating pulse waveform, after 20 years of hard work, finally it has been commercialized. The Power MOSFET pulse generator now can completely remove the disadvantages of SCR pulse generator and achieving a new method for testing coil.
The new coil layer short testing method is based on the method of Power MOSFET generating pulse wave, applying the pulse wave to the coil and turning off immediately, then the self-resonance wave will generate in the coil.
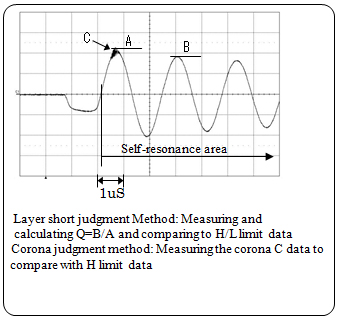
We measure the first peak wave value (A) and the second peak wave (B) from the self-resonance wave, then defining it as Quality data=B/A by "Q=**.*%" expression.
SCR Pulse Generator Power MOSFET Pulse Generator 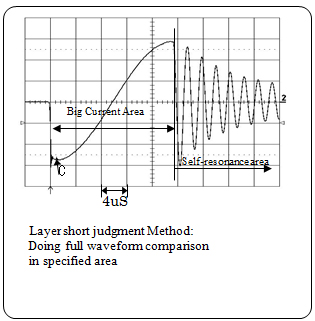
→Improved the capacity of detecting coil layer short
 As described in Power MOSFET pulse waveform test, Q value comparison judgment method is not affected by applying voltage changes, and also not affected by core permeability, which are unrelated to coil layer short. This method can greatly improve the accuracy of judgment, at the same time it ruled out the shortcoming of big current that happened in SCR pulse generator method, so we do not need to worry again if the impulse test will damage the coil.
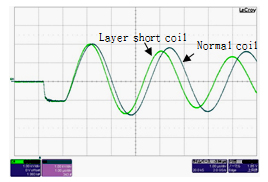
The left waveform shows the smaller Q value caused from one turn layer shorted of coil by simulated.
As described in Power MOSFET pulse waveform test, Q value comparison judgment method is not affected by applying voltage changes, and also not affected by core permeability, which are unrelated to coil layer short. This method can greatly improve the accuracy of judgment, at the same time it ruled out the shortcoming of big current that happened in SCR pulse generator method, so we do not need to worry again if the impulse test will damage the coil.
The left waveform shows the smaller Q value caused from one turn layer shorted of coil by simulated.
Black waveform: Normal coil, Green waveform: one turn layer short simulation.
The reducing Q value of about 9.2% is enough to determine the motor coil is good or bad.
In the real test, we could set the effective Q value for detecting the bad coil, the effective Q value are from real testing on the coils sampling from producing line and layer short simulation data. Testing the motor coils, we do need to assess the factors of the air magnetic field and the core material uncertainty to confirm if it will affect the Q value measurement.
→Higher detecting sensitivity in corona data and showing up the corona data on the PC with graph bar
On the left waveform of first page, it shows Corona occurred at the maximum Voltage point of SCR pulse; the Corona is happened at same time with the highest Voltage point.
But, on the right waveform of first page, it is by the method of Power MOSFET pulse generator, Corona occurs at the maximum Voltage point of the coil free resonant area after the high Voltage pulse disappeared, at this point, the harmful pulse waves will be reduced to the extent of 1/10 to 1/20 comparing to SCR pulse mode, therefore, it is easier to detect relatively the value of the low potential Corona. (S/N ratio is getting high)
It is very important thing for that Corona and Q values could be tested at same time.
The purpose of Q value detecting function is to detect out the coils that has layer short occurred, but the purpose of Corona detecting function is to detect out the coils that have been injured but not yet layer short occurs, such coils may be gradually deteriorating then becoming layer short occurs after used.
In the method of Power MOSFET pulse generator, after the end of the pulse wave applying, Corona may begin to occur at around peak position of first positive resonant wave.
6160 has built in the function of Corona Gate time programmable for control the time period of logging Corona data, allowing setting the period time after finished applying pulse wave. Such a feature can enhance the S/N ratio, the more easily measured valid Corona data.
With Power MOSFET as a high-voltage pulse switch can get a very good resonance wave, therefore, we could measure good Corona data with high sensitivity circuit from Corona occurred point. Such non-destructive pulse wave and the ability of detecting low potential Corona indeed can detect the coil problems.
6160 also provides an assessment way to evaluate Corona data correctly with graphical Corona data, said X-Y Graph, X-axis = Applying Pulse Voltage / Y axis = Corona potential value, in this test pattern may allow to quickly and accurately determineand Corona Graphic Data
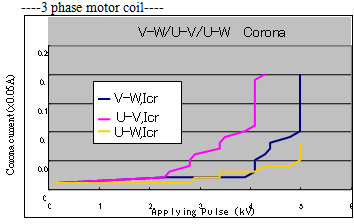
 Corona occurred between U-V coil
It can be seen clearly to determine Corona phenomenon occurred in the vicinity of 2.5kV. This method can be applied to determine quality assessment of motor coil at the stage of product development, can also be effectively used for quality control after mass producing.→Saving all tested data of coil into PC, including corona data
Via USB interface, each individual test data can be stored on the PC, such as the following data table
No Vap kV Vres kV Qual % Peri uS Cor 1/0 Cor kV NG Code 0001 2.00 2.50 61.0 10.2 0 0.03 0 0002 2.00 2.51 61.5 10.2 0 0.04 0 0003 2.00 2.49 61.8 10.3 0 0.02 0 0004 2.00 2.51 61.2 10.2 1 ーーー 8 In the column
data of this test table indicates if the Corona high limit function is working or not, if it is 0, means it is working, then the actual Corona test value is recorded in column with the 1/10 of the set value represented as a unit.
For example with Corona high limit setting as 0.1kV, the test value will be 0.01,0.02, .......... 0.1kV.
Such test data for qualified products, the tested data relative to the Corona high limit are still very reliable security space gap, so it can be an effective quality control of the data.→Showing up the resonance waveform and corona data waveform on the PC simultaneously
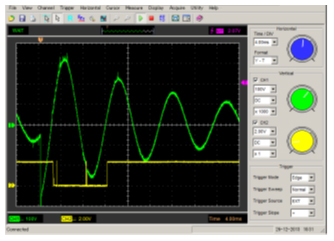
 Green wave: Coil Self-resonance Wave
 Yellow Wave: Corona gate time status
and Corona measured data
Yellow Wave: Corona gate time status
and Corona measured data
The 6160 comes with a CD to install the software on the Windows PC as a waveform can be displayed on the left.
The high-voltage pulse wave, coil resonant wave, Corona time gate and Corona data are displayed together on the same screen.→6160 could be used as Corona instrument, applying for insulation evaluation of electrical wire
The attenuating shock wave of around 100Hz continuous sine wave
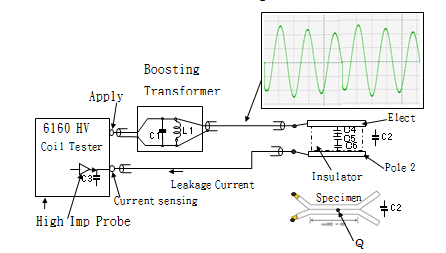
6160HV+ Boosting transformer Becoming a Corona instrument 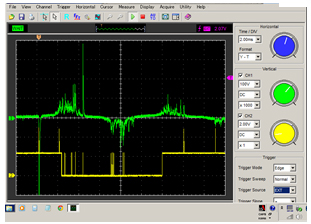 Green wave: Leakage and Corona Current
Yellow wave: Corona time gate status and Corona data
Green wave: Leakage and Corona Current
Yellow wave: Corona time gate status and Corona data
6160 can be used to assess the insulating properties of the insulating film of two electrodes, such as insulation properties owned small capacitance between the wires of cable, or between the coil and the core.
It could be defined as a circuit from the transfer function of between Corona generators to the detection capacitor.
In 6160 can set Corona high limit value by the unit of <□□□□pCmb>, and can be set <10 aliquots test function> of optional function to measure 100,200,......... 1000pCmb data.
- Specification
Coil Tester 6160 Standard Specification
Control point Low Limit Control Resonant Voltage (Current).................................□.□□ kV (A) High/Low Limit Control Quality (Q Value)................................................□□.□ % Low Limit Control Wave Period (Current)................................□□□□.□ uS High Limit Control Corona Quantity (Peak Voltage or A)................□.□□ kV (A)
Items Specification Accuracy Impulse Voltage -0.1~-6.00kV/Variable setting by 0.01kV step High accuracy electronic servo-amplifier controller, no influence from power supply ±0.2kV or ±20% for small one Output Current 100A Max. ----- Pulse wave width 0.6~ 4uS by manual selection Within ±20% of setting Pulse output interval time 40mS fixing time Within ±10% Test speed Pass or Fail result comes out in 50mS after start-command, then will have test result in 40mS for next test-command coming ----- Output Voltage Measurement 0.00~9.99kV for Apply Voltage,
Resonant Voltage and low limit Voltage, Resolution: 0.01kVWithin ±0.1kV Quality Measurement (Q value) 0.00~99.9% setting for High/Low limit within ±3% for tested wave data, the specimen is for 100H~100uH Wave Period Measurement
(Wave width)0.10~9999uS setting for Low limit within (±0.1%±1digit) for tested wave data, the specimen is for 100H~100uH Corona Quantity Measurement (Corona Voltage) 0.01~3kV(0-p) setting for High limit by 4Mhz,8Mhz Chebyshev approximation HPF Calibrated by the experiment data of pseudo corona generator and the calculated data Test conditions setting operation Manual mode: All test conditions could be set by 3 manual keys and 4 arrow keys on panel. PC mode: Selecting the preset test conditions that copied from PC through SD card. Test data saving method 1. Real time data saving in PC by USB I/F 2. Real time data saving in SD card Corona graphic generation The corona graph could be generated automatically from PC with Apply Voltage range and Corona data range setting Wave Monitoring software Shipping along the software that could monitor real time testing wave
(for Windows-XP and Windows-7)DC~20MHz with +1,-3dB, Voltage divider=1/1000 Power Supply AC 90~240V, 50/60Hz Within 70VA Weight and Size Machine Weight: 7.5kg, Accessories: 0.5kg (W)370mm/(H)150mm/(D)355mm, 410mm for Handle width Accessories: HV Coaxial cable, Signal Coaxial cable, Power Cable and remoter
- Other 1

NOA CORPORATION Co., Ltd.
4-31-9 Nakanokamicho, Hachioji-city, Tokyo, 192-0041, JAPAN
TEL: +81-42-628-3199
FAX: +81-42-628-3198
http://www.noa-c.co.jp

Satake Asia Sales & Services Co., Ltd.
No. 21, Lane 86, Wugong 3rd Rd, Xinzhuang Dist, New Taipei City (24889), Taiwan, R.O.C.
TEL: +886-2-2298-4880
FAX:+ 886-2-2298-4881
E-mail: steven@satakeasia.com